The Next Evolution of SAC Excel Add-in

The SAC Excel Add-in has continued to evolve, bringing governance, collaboration, and efficiency directly into the spreadsheet environment. This article highlights the most recent updates—including story transfers, in-cell comments, and restricted measures—and offers practical takeaways to help finance teams adopt these features effectively....
SAC Excel Add-in updates

What Is the SAC Excel Add-in?

The SAP Analytics Cloud (SAC) Excel Add-in—sometimes referred to as SAC for Excel or the SAC add-in for Microsoft Office—connects SAC directly to Microsoft Excel. It allows users to pull live SAC data into spreadsheets, perform planning and analysis tasks, and push updates back into the system, all without leaving Excel.

Essentially, it combines Excel’s flexibility with SAC’s governance, collaboration, and live data connectivity. For organizations balancing speed, familiarity, and control, the Add-in is increasingly becoming a core part of the finance workflow. 

The Excel Debate: Friend or Foe?

Excel has been the backbone of finance and planning for decades:

Why it’s loved:

  • Flexible for ad-hoc analysis and modeling
  • Familiar to finance teams
  • Fast to set up and iterate


Why it’s criticized:

  • Prone to errors from manual inputs and static formulas
  • Hard to maintain governance and version control
  • Challenging to scale for enterprise-wide collaboration


The SAC Excel Add-in doesn’t replace Excel—it enhances familiar workflows by integrating SAC governance, live data, and collaboration features. Recent updates in 2025 make these enhancements more visible and practical for daily use.

What’s New in the SAC Excel Add-in

Finance teams rely on Excel for flexibility, but SAC provides governance, collaboration, and live data. Recent updates have turned the SAC Excel Add-in into a bridge between these two worlds, delivering both speed and control. Here are the six most impactful new features:

      1. Story-to-Excel Tables
        • What it does: Transfer tables from SAC Stories into Excel, keeping filters, variables, dimensions, and measures intact.
        • Why it matters: Analysts can quickly move from dashboards to granular analysis without rebuilding queries, saving time and preserving context.
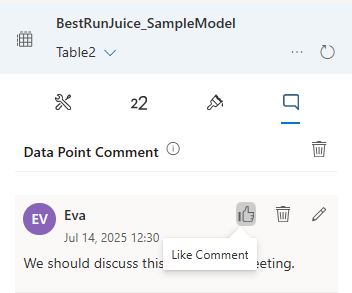
      2. Data Point Comments & Collaboration
        • What it does: Add and view comments on individual cells, synchronized with SAC. Retrieve comments programmatically with SAP.GETDATACOMMENT.
        • Why it matters: Enables real-time collaboration and makes qualitative insights actionable for reporting, dashboards, and KPIs.
          Data Point Comments Example


          Comments are edited and shown in the new tab Data Point Comment in the designer panel. Image source: SAP
      3. Enterprise Governance Inside Excel
        • What it does: Data Access Controls (DCS) and validation rules from SAC now apply in Excel tables.
        • Why it matters: Reduces risk from manual spreadsheets while allowing teams to work in a familiar tool.
      4. Drag-and-Drop Table Builder
        • What it does: Drag dimensions and measures from the permanent pane into table rows or columns; resizable pane and search make object selection easier.
        • Why it matters: Streamlines analysis, reduces clicks, and speeds up common tasks for planners and analysts.
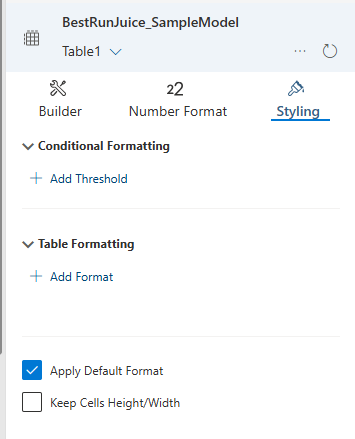
      5. Styling & Formatting Enhancements
        • What it does: Apply corporate color and custom styles to contiguous or non-contiguous cell ranges.
        • Why it matters: Creates cleaner, more consistent layouts for reporting, presentations, and stakeholder communication.
          Styling & Formatting Example
          The option Apply Default Format is now available as a setting on the Styling panel. Image source: SAP
      6. Restricted Measures & Accounts
        • What it does: Create and edit restricted measures and accounts directly in Excel for advanced planning comparisons.
        • Why it matters: Supports subset analysis and variance reporting without rebuilding tables, reducing errors and improving insight accuracy.
          Restricted Measures Example
          Add restricted measures and restricted accounts in your table by excluding certain members of one or more dimensions. Image source: SAP
      7. Other Notable Updates from 2025
        • Support for VBA macros in Excel desktop workbooks
        • Optimized planning area and improved data action triggers
        • Front-end calculations anchored to totals
        • Improved workbook design and object management
        • Sign-in improvements and multi-tenant support

Why These Updates Matter

These updates show how the Add-in can enhance existing workflows without forcing teams to change tools. Finance and planning teams gain:

  • Faster analysis with drag-and-drop and story transfers
  • Better collaboration with comments and formula enhancements
  • Stronger governance and reduced spreadsheet risk
  • Clearer reporting with styling and restricted measures

Practical Takeaways for Finance Teams

  1. Update to the latest version to access all features.
  2. Pilot high-impact use cases such as forecasting, reconciliations, or variance analysis.
  3. Align with SAC governance rules to enforce security and data integrity.
  4. Educate users on new drag-and-drop functionality, comments, and restricted measures to maximize adoption.

Tips to Apply the New Features

  1. Leverage story transfers: Move tables from SAC dashboards into Excel to perform deeper what-if analysis without rebuilding queries.
  2. Use data point comments: Add context directly in Excel cells, and retrieve commentary in reports or dashboards with SAP.GETDATACOMMENT
  3. Apply governance rules: Verify that Data Access Controls (DCS) and validation rules are working as intended inside your tables.
  4. Streamline table building: Use the drag-and-drop pane to add dimensions or measures quickly when designing tables.
  5. Standardize formatting: Apply corporate styles and thresholds for cleaner, more consistent reporting.
  6. Take advantage of restricted measures: Create subset comparisons and variance analysis directly in Excel.
  7. Explore the resizable builder panel: Keep the object list open for faster access to dimensions and measures during analysis.
SandPoint Consulting
SandPoint Consulting specializes in digital transformation for the finance function, offering tailored solutions for budgeting, planning, forecasting, and financial close. With nearly 25 years of experience, our team of finance and accounting professionals understands the challenges our clients face and provides personalized, no-cookie-cutter implementations. As a trusted partner, we help organizations streamline processes, migrate seamlessly from legacy systems, and achieve sustainable, long-term success.

Trending insights

BlackLine
SandPoint Consulting

Account Reconciliation in BlackLine: How Finance Teams Close Faster with Less Risk

Account reconciliation is a key part of the financial close process, often complicated by spreadsheets and manual approvals. BlackLine streamlines this with a centralized, automated solution that enhances reconciliations and improves visibility. By reducing time spent on repetitive tasks, finance teams can focus on strategic analysis. With features like auto-certification for low-risk accounts and real-time dashboards, achieve faster closures with greater confidence. Discover how BlackLine is revolutionizing account reconciliation for finance professionals.

Read More »
Industry Insights
SandPoint Consulting

Beyond Buyer’s Remorse: How CFOs Can Ensure Strategic ROI from Finance Software Investments

CFOs are under pressure to make technology investments that deliver both short-term efficiency and long-term value. Yet nearly four in five buyers report regret over recent technology purchases. From misaligned goals to messy implementations, the consequences extend beyond wasted budget — they affect team productivity, morale, and strategic momentum. Here’s how finance leaders can avoid technology regret and make smarter, future-proof software decisions.

Read More »